Intellisense - Building IoT
Contributions:
User Experience
UI Design
About the Project
Disclaimer
Because of non-disclosure agreements, I cannot go into full detail about this project online.
Feel free to contact me to learn more and chat.
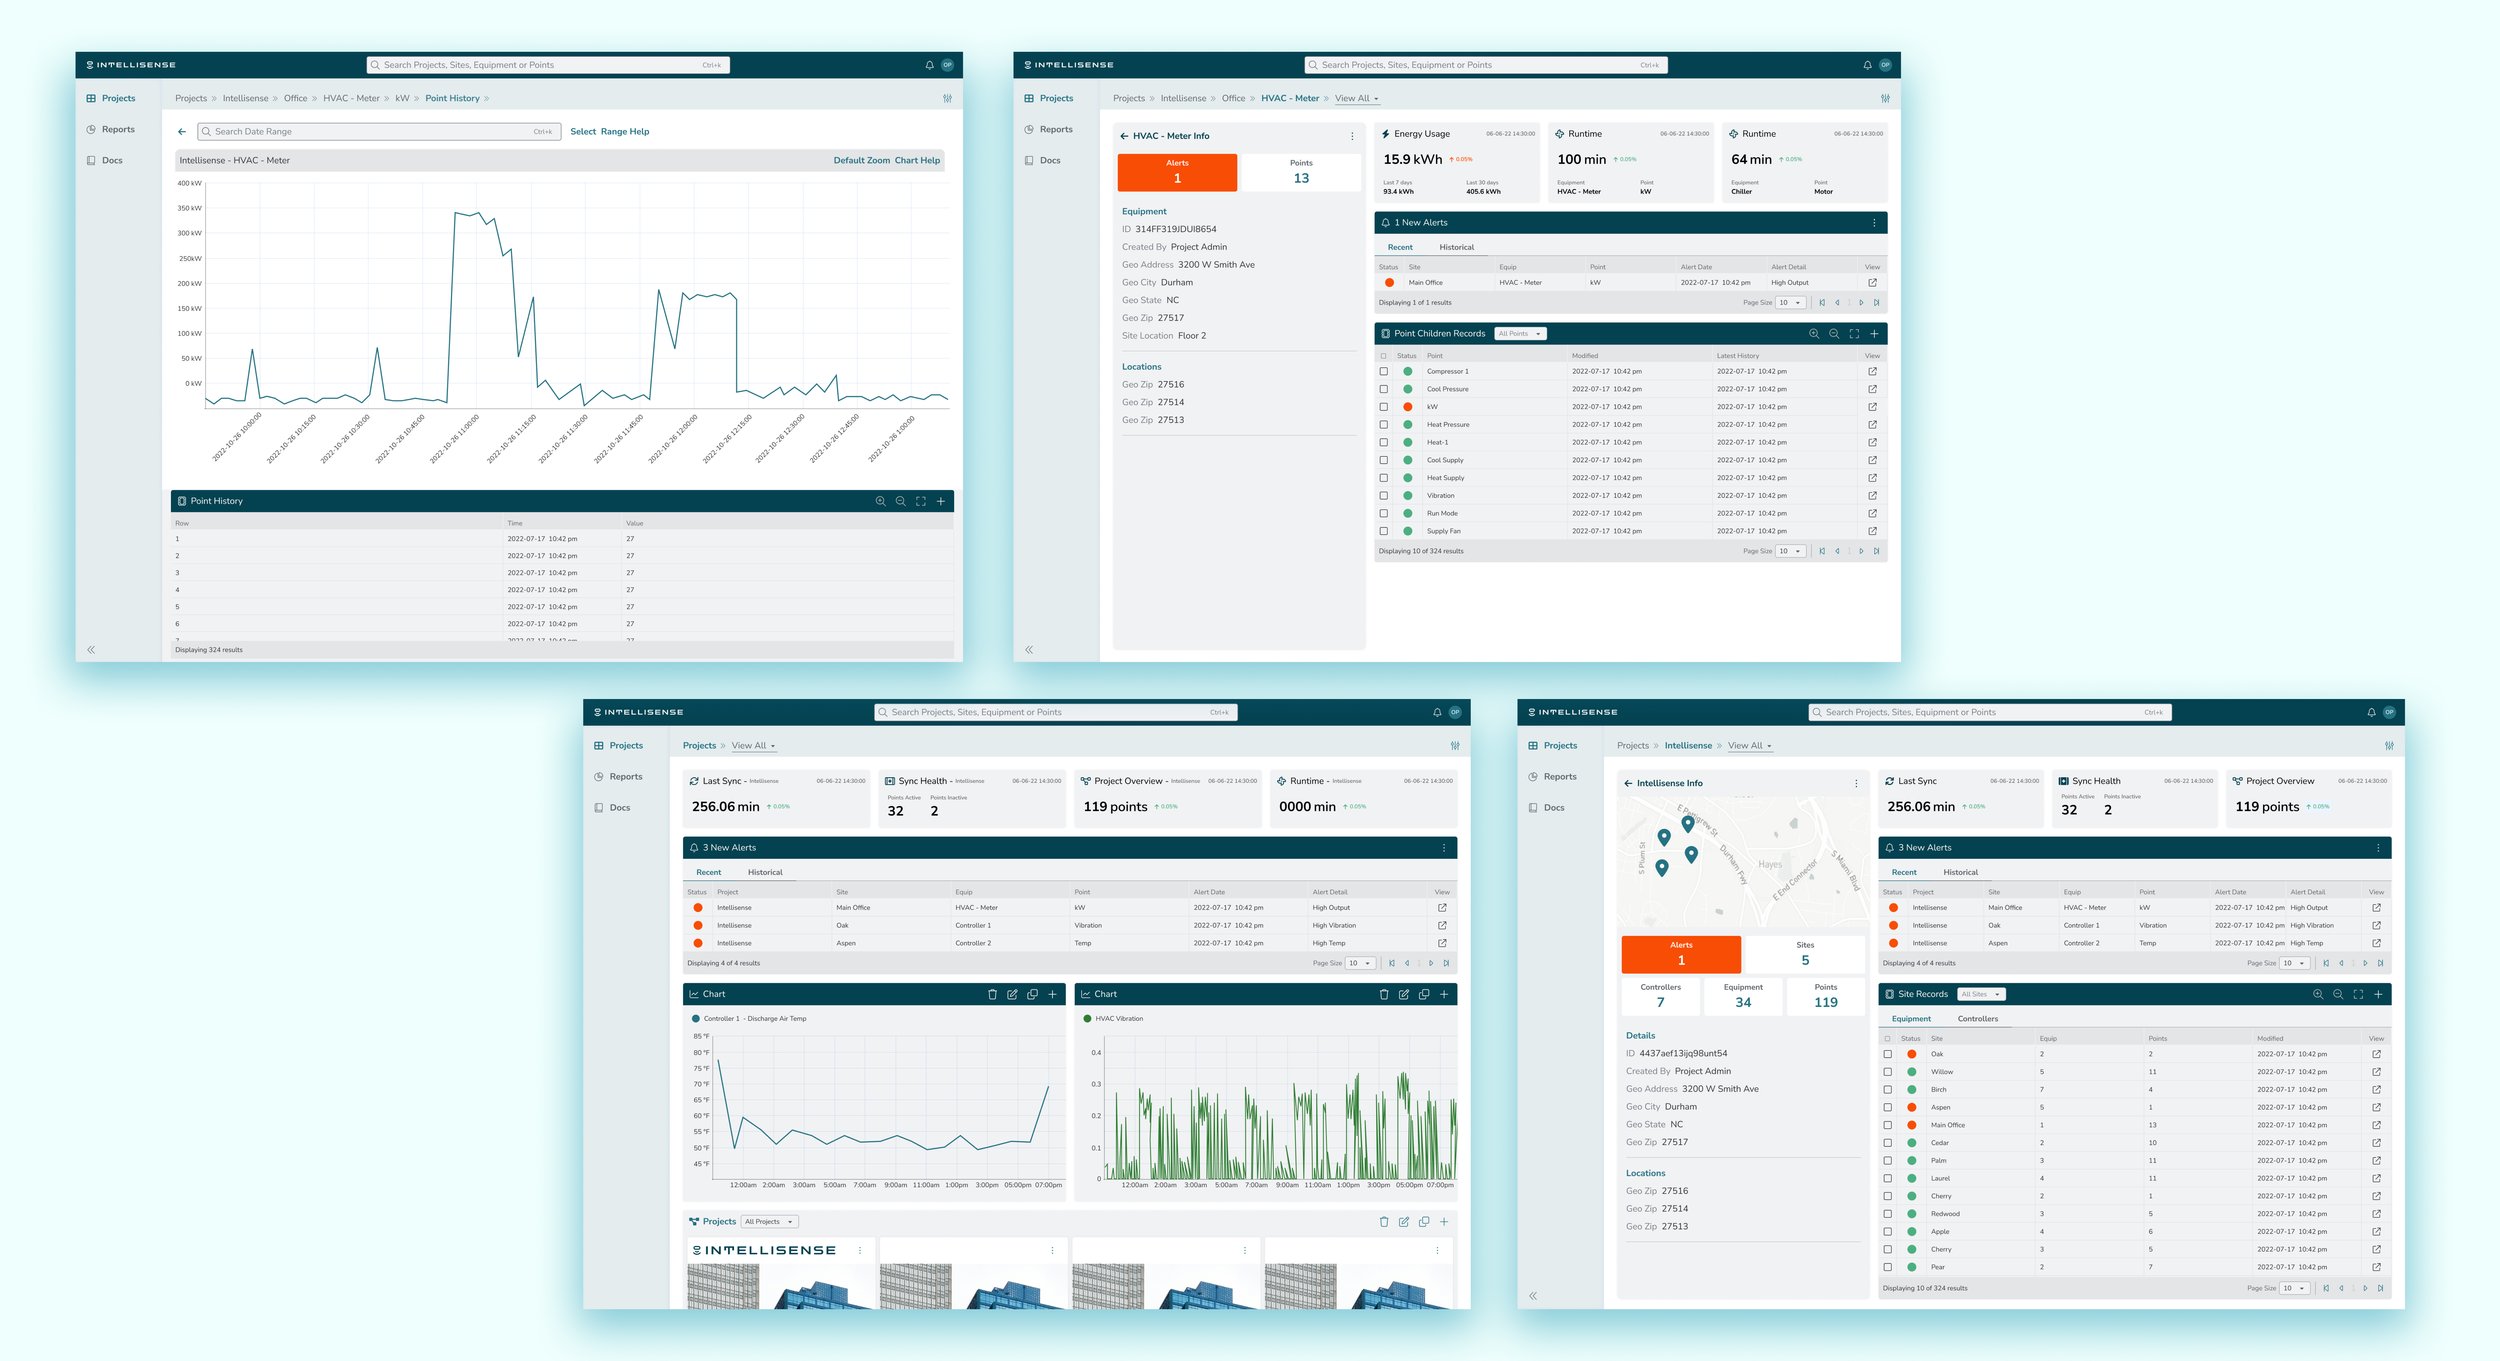
The Intellisense application was designed for an intelligent building equipment company to help users view their building’s equipment and act quickly on alerted assets. The application handles equipment from the project level all the way to the individual analytics coming off of sensors. This project involved updating a legacy system for the client to update the user experience as well as the look and feel.
Main focuses from a UX standpoint:
Research & Planning: Working with the client, we fully reviewed their current system, mapped out its current structure, and from the requirements mapped a new application architecture that simplified the complexity of their existing product. From a visual standpoint, in this phase, we also provided some options for interface direction to see how they wanted their product to be elevated.
Design: After gathering requirements and reviewing the current application, we moved into the design phase based on our pre-established use case flows. While updating the user interface to appear more modern and clean, we also wanted to provide a clean-cut subscription flow that helped guide the user.
Research & Planning
When starting this project, mapping the current application and account structure was required to update the overall user experience. Alongside this, we also had to fully understand how the equipment interacted with their controller system and what all from the legacy application would be maintained.
Simplify workflows that previously were targeted at a developer-level understanding of accessing data.
Gathered involved equipment and information that comes off of asset sensors.
Uncover main use cases & personas.
Plan out front-end application architecture.
Layout user and informational flows that would help inform content within the application.
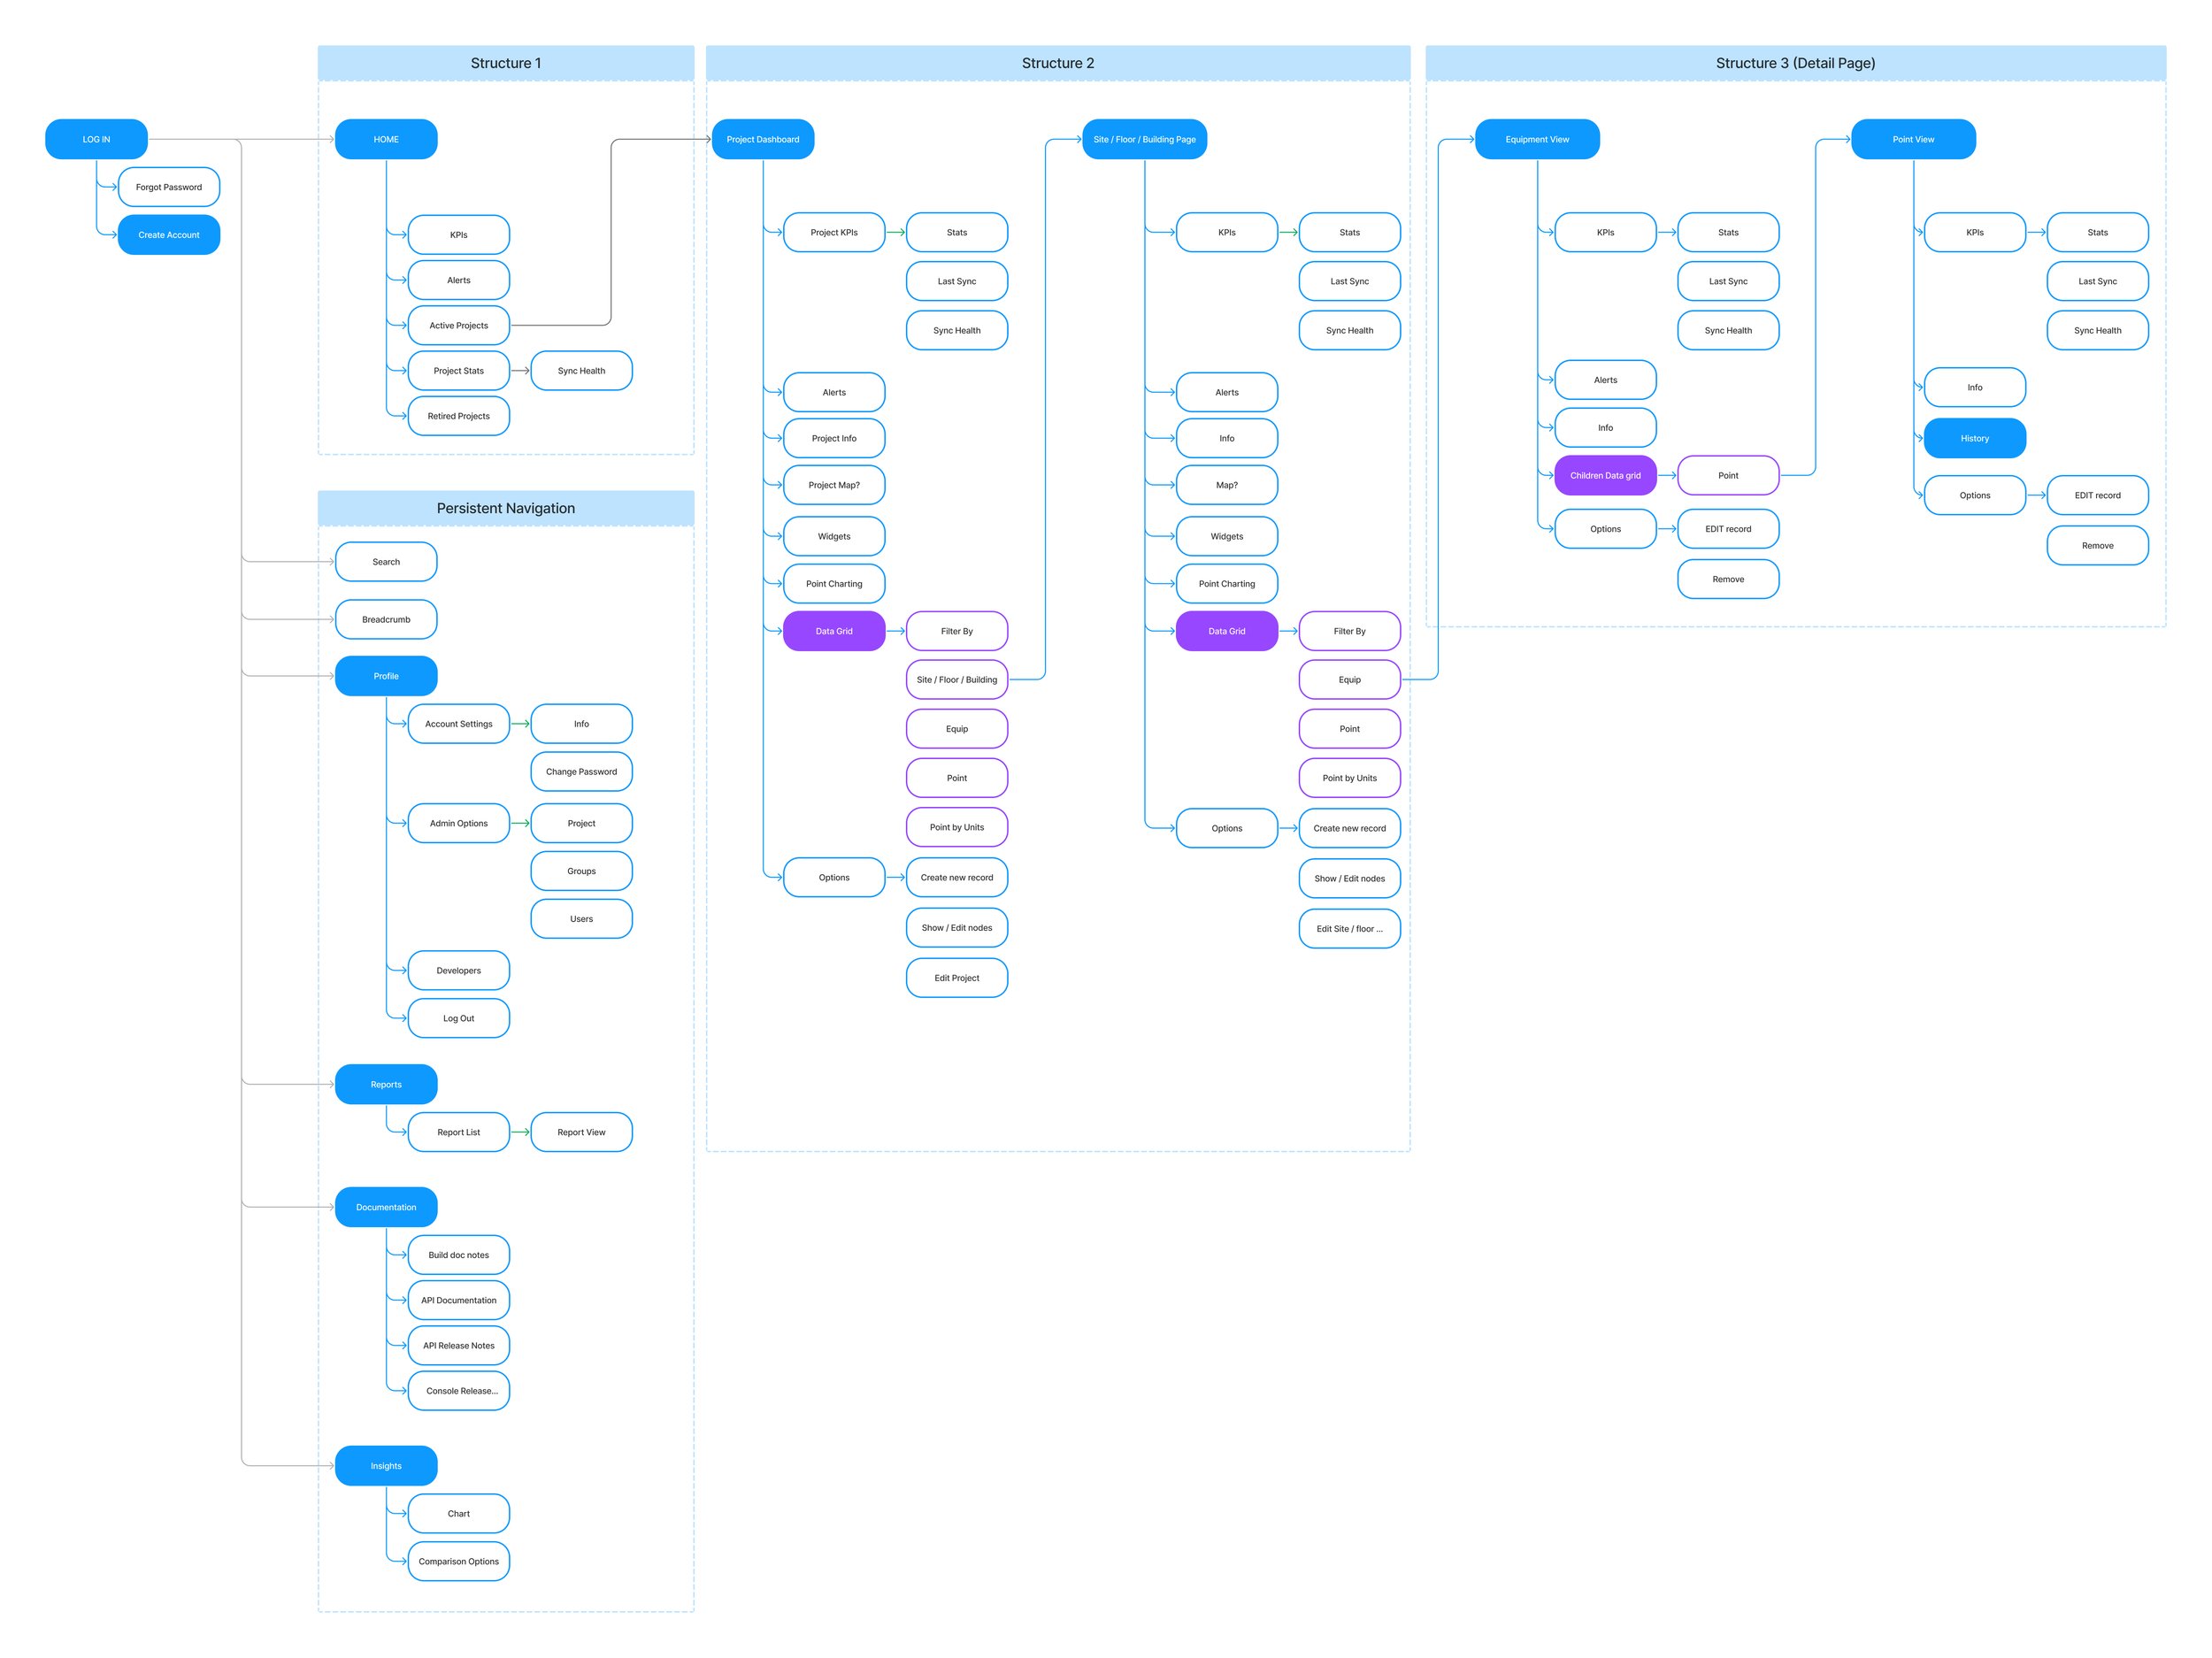
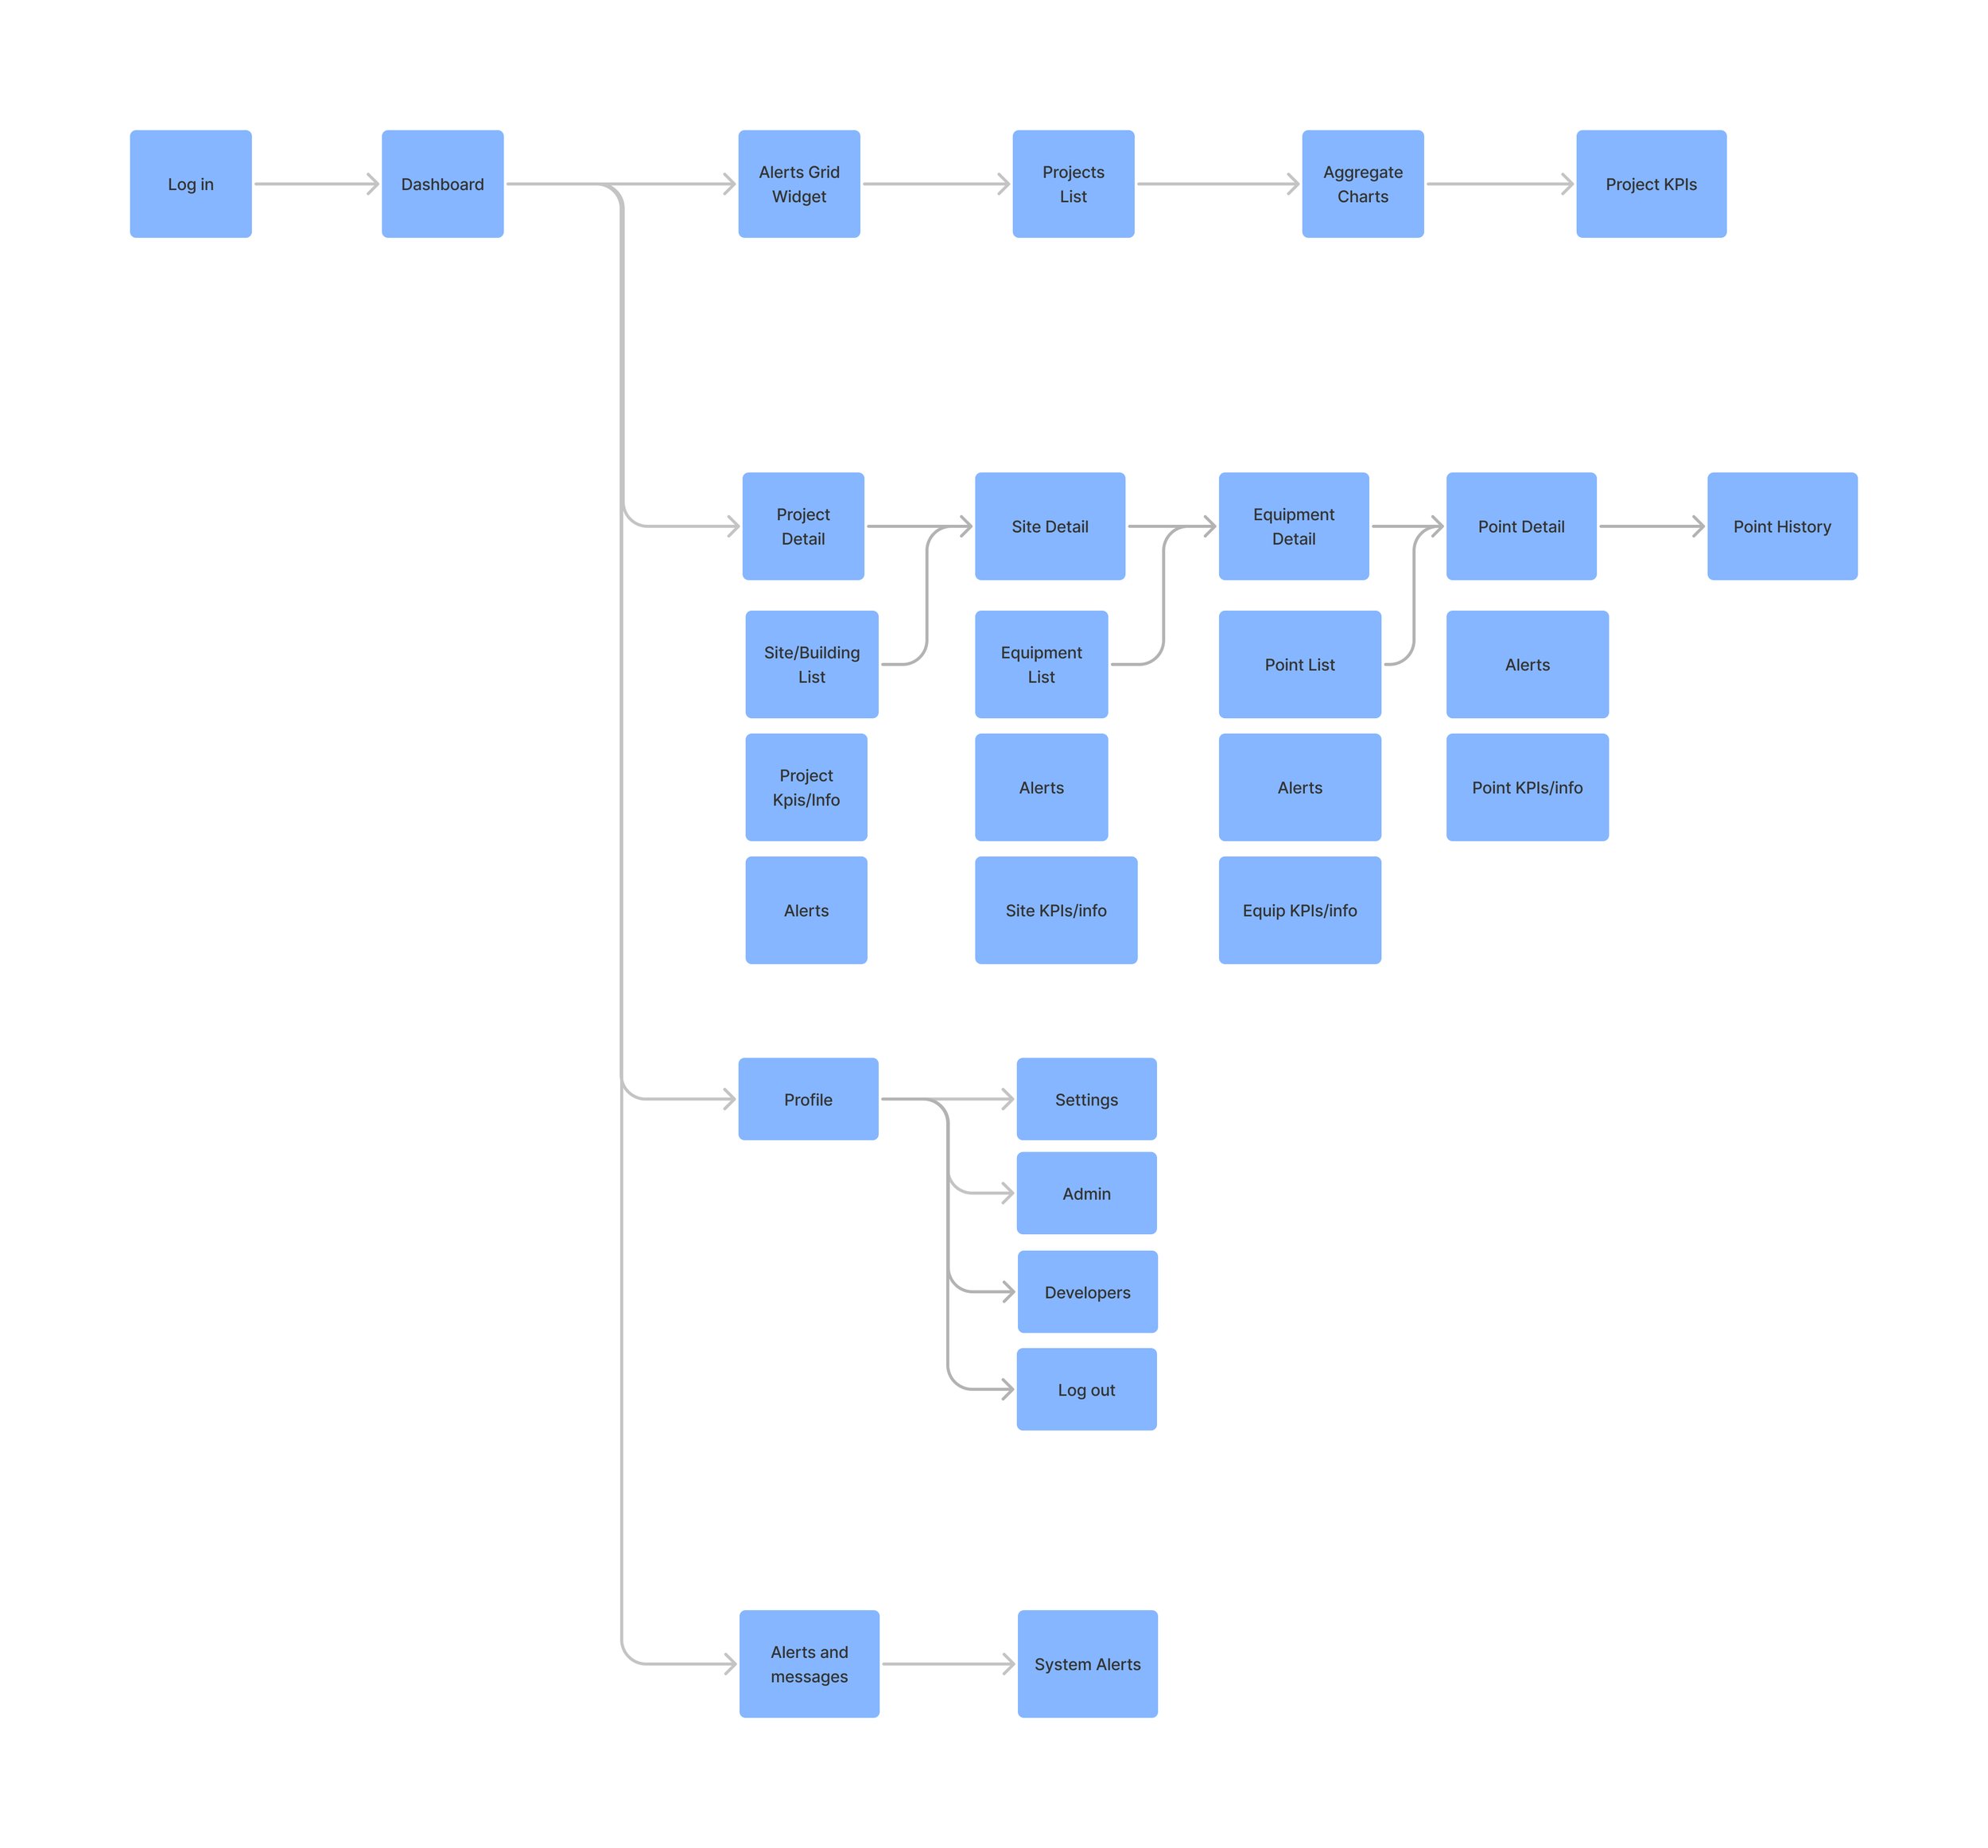
Application Mapping Legacy VS New
After reviewing demos presented by the client, we continued to map out their current application to understand what content was needed during the refactor. We then mapped out the new architecture sticking to the requirements and providing a logical workflow for users.


Top Use Cases/User Flows
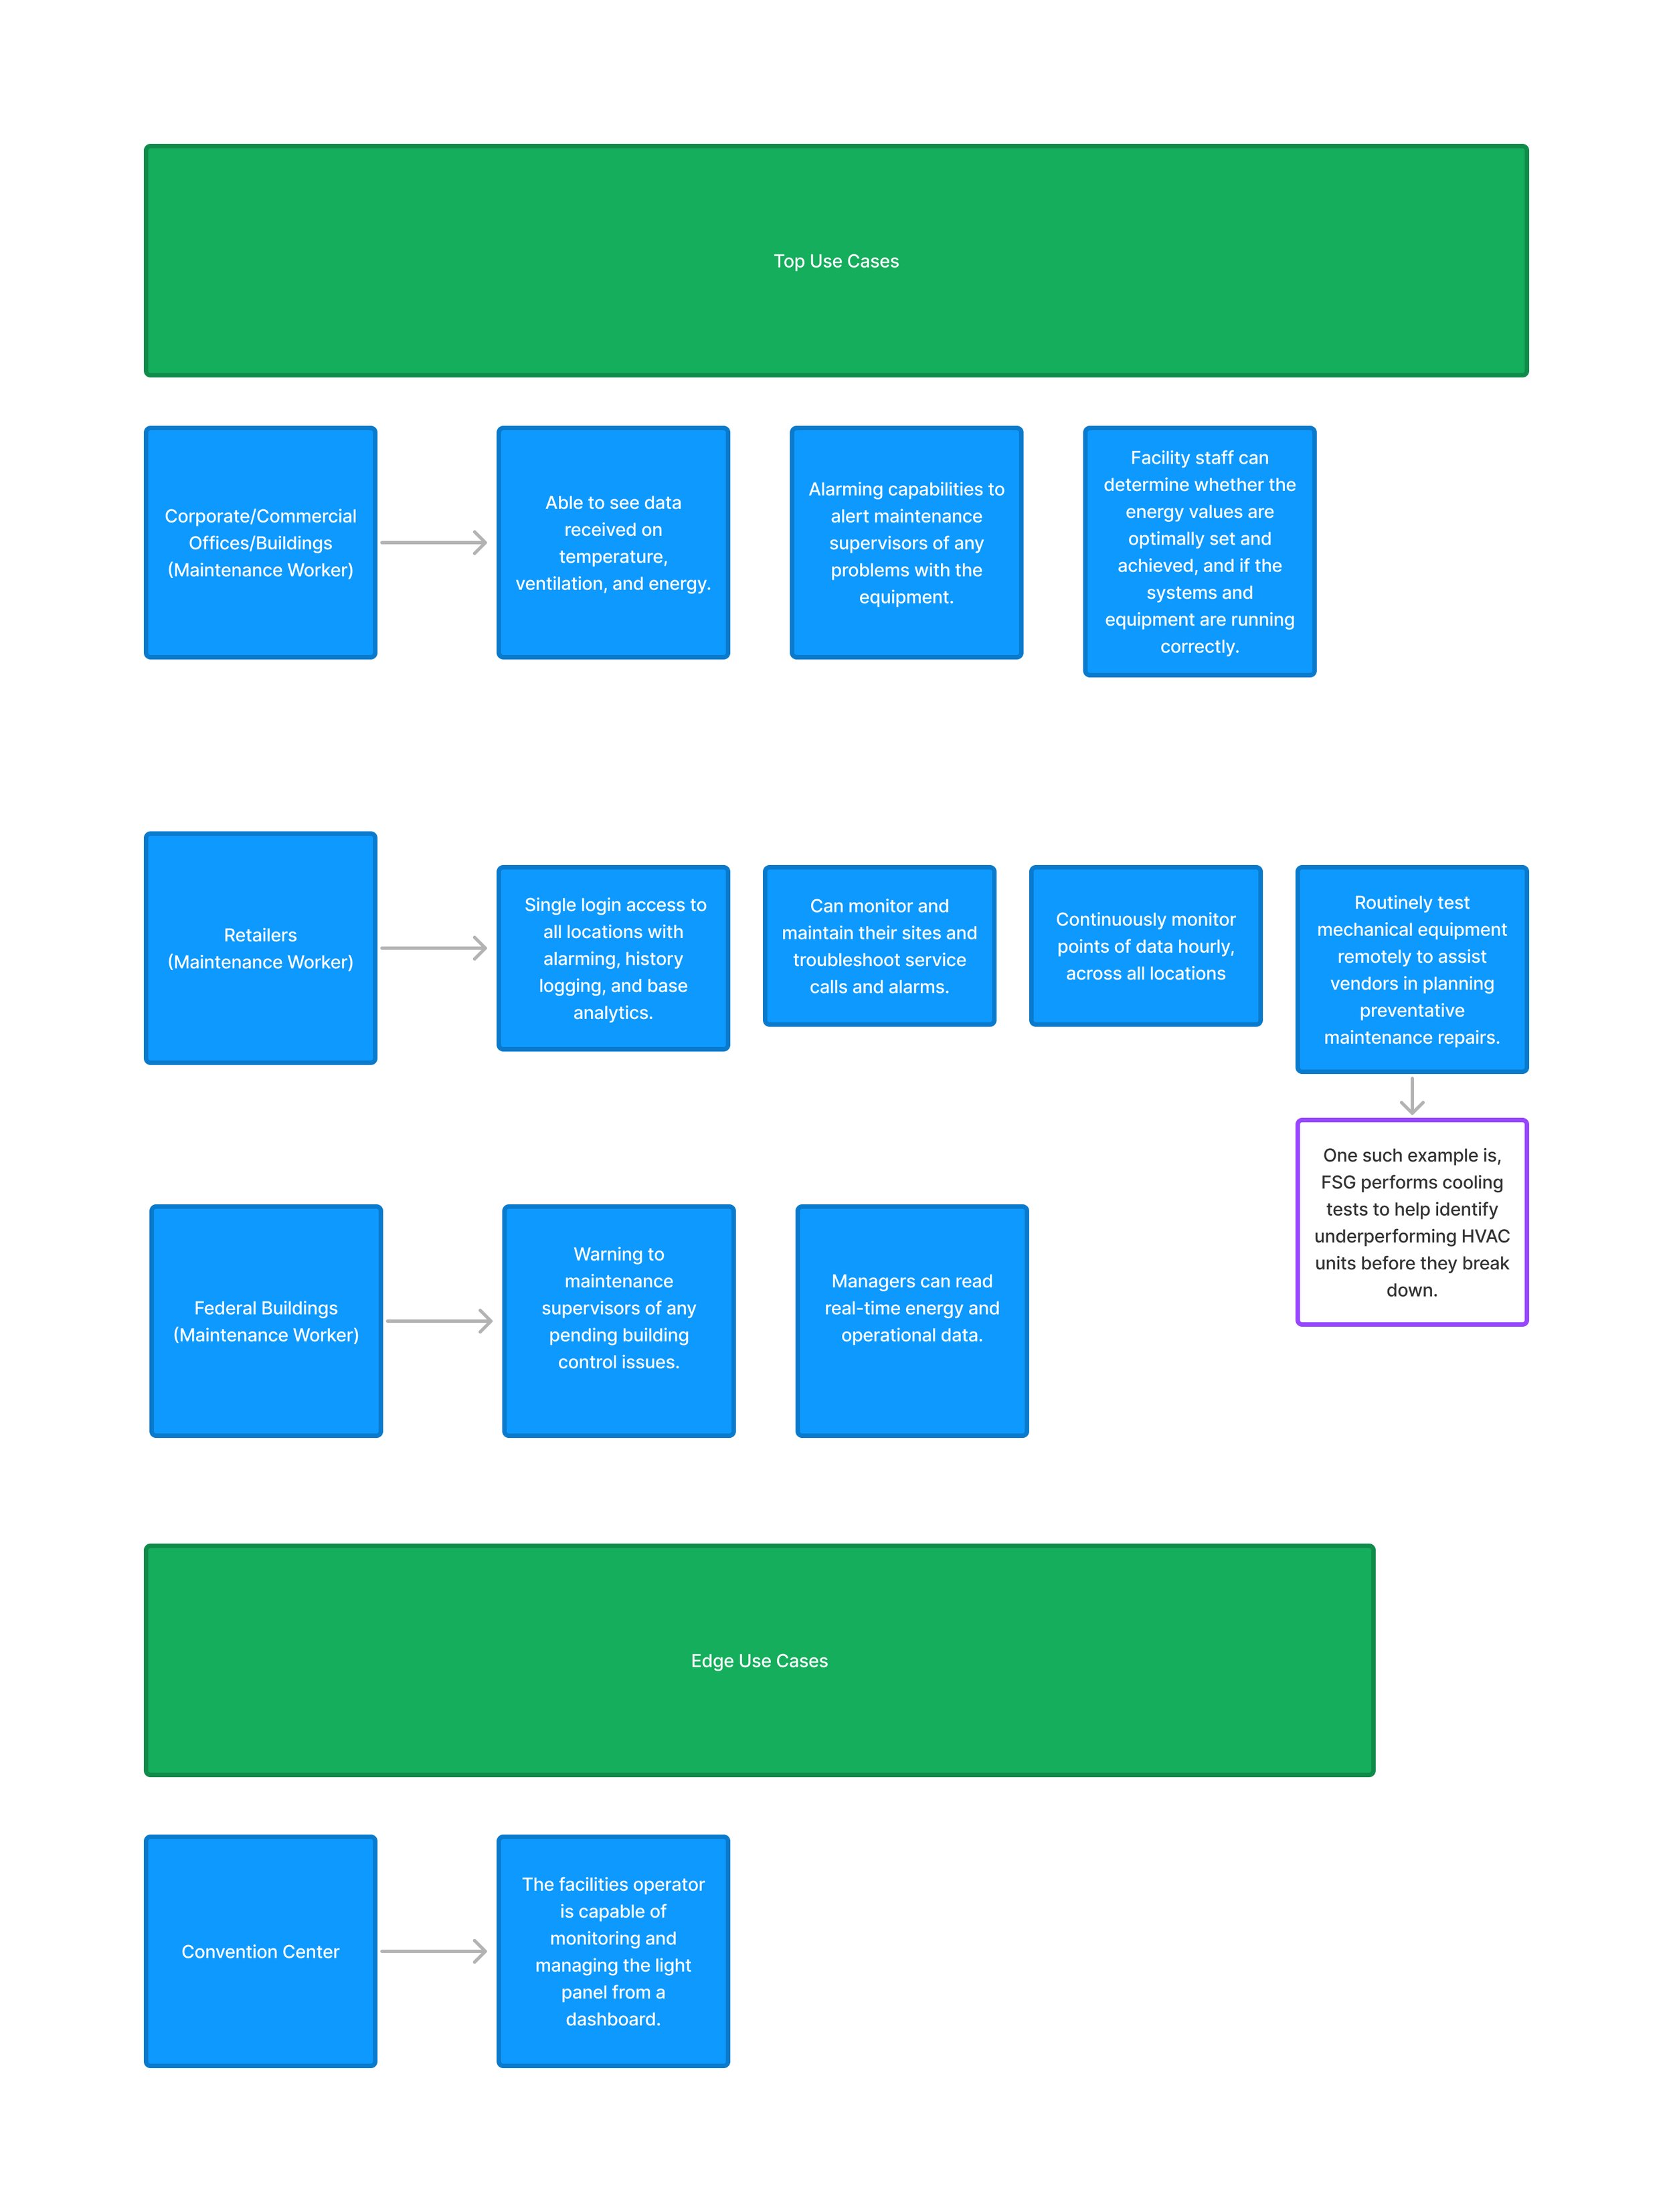
Once familiarizing ourselves with the application we needed to understand its users. Working with the client, we pinpointed the key use cases and what a user of each type would be viewing within the application.
All top use cases involved maintenance workers across multiple-sized industries:
Corporate/commercial office building maintenance worker
Retail maintenance worker
Federal building maintenance worker
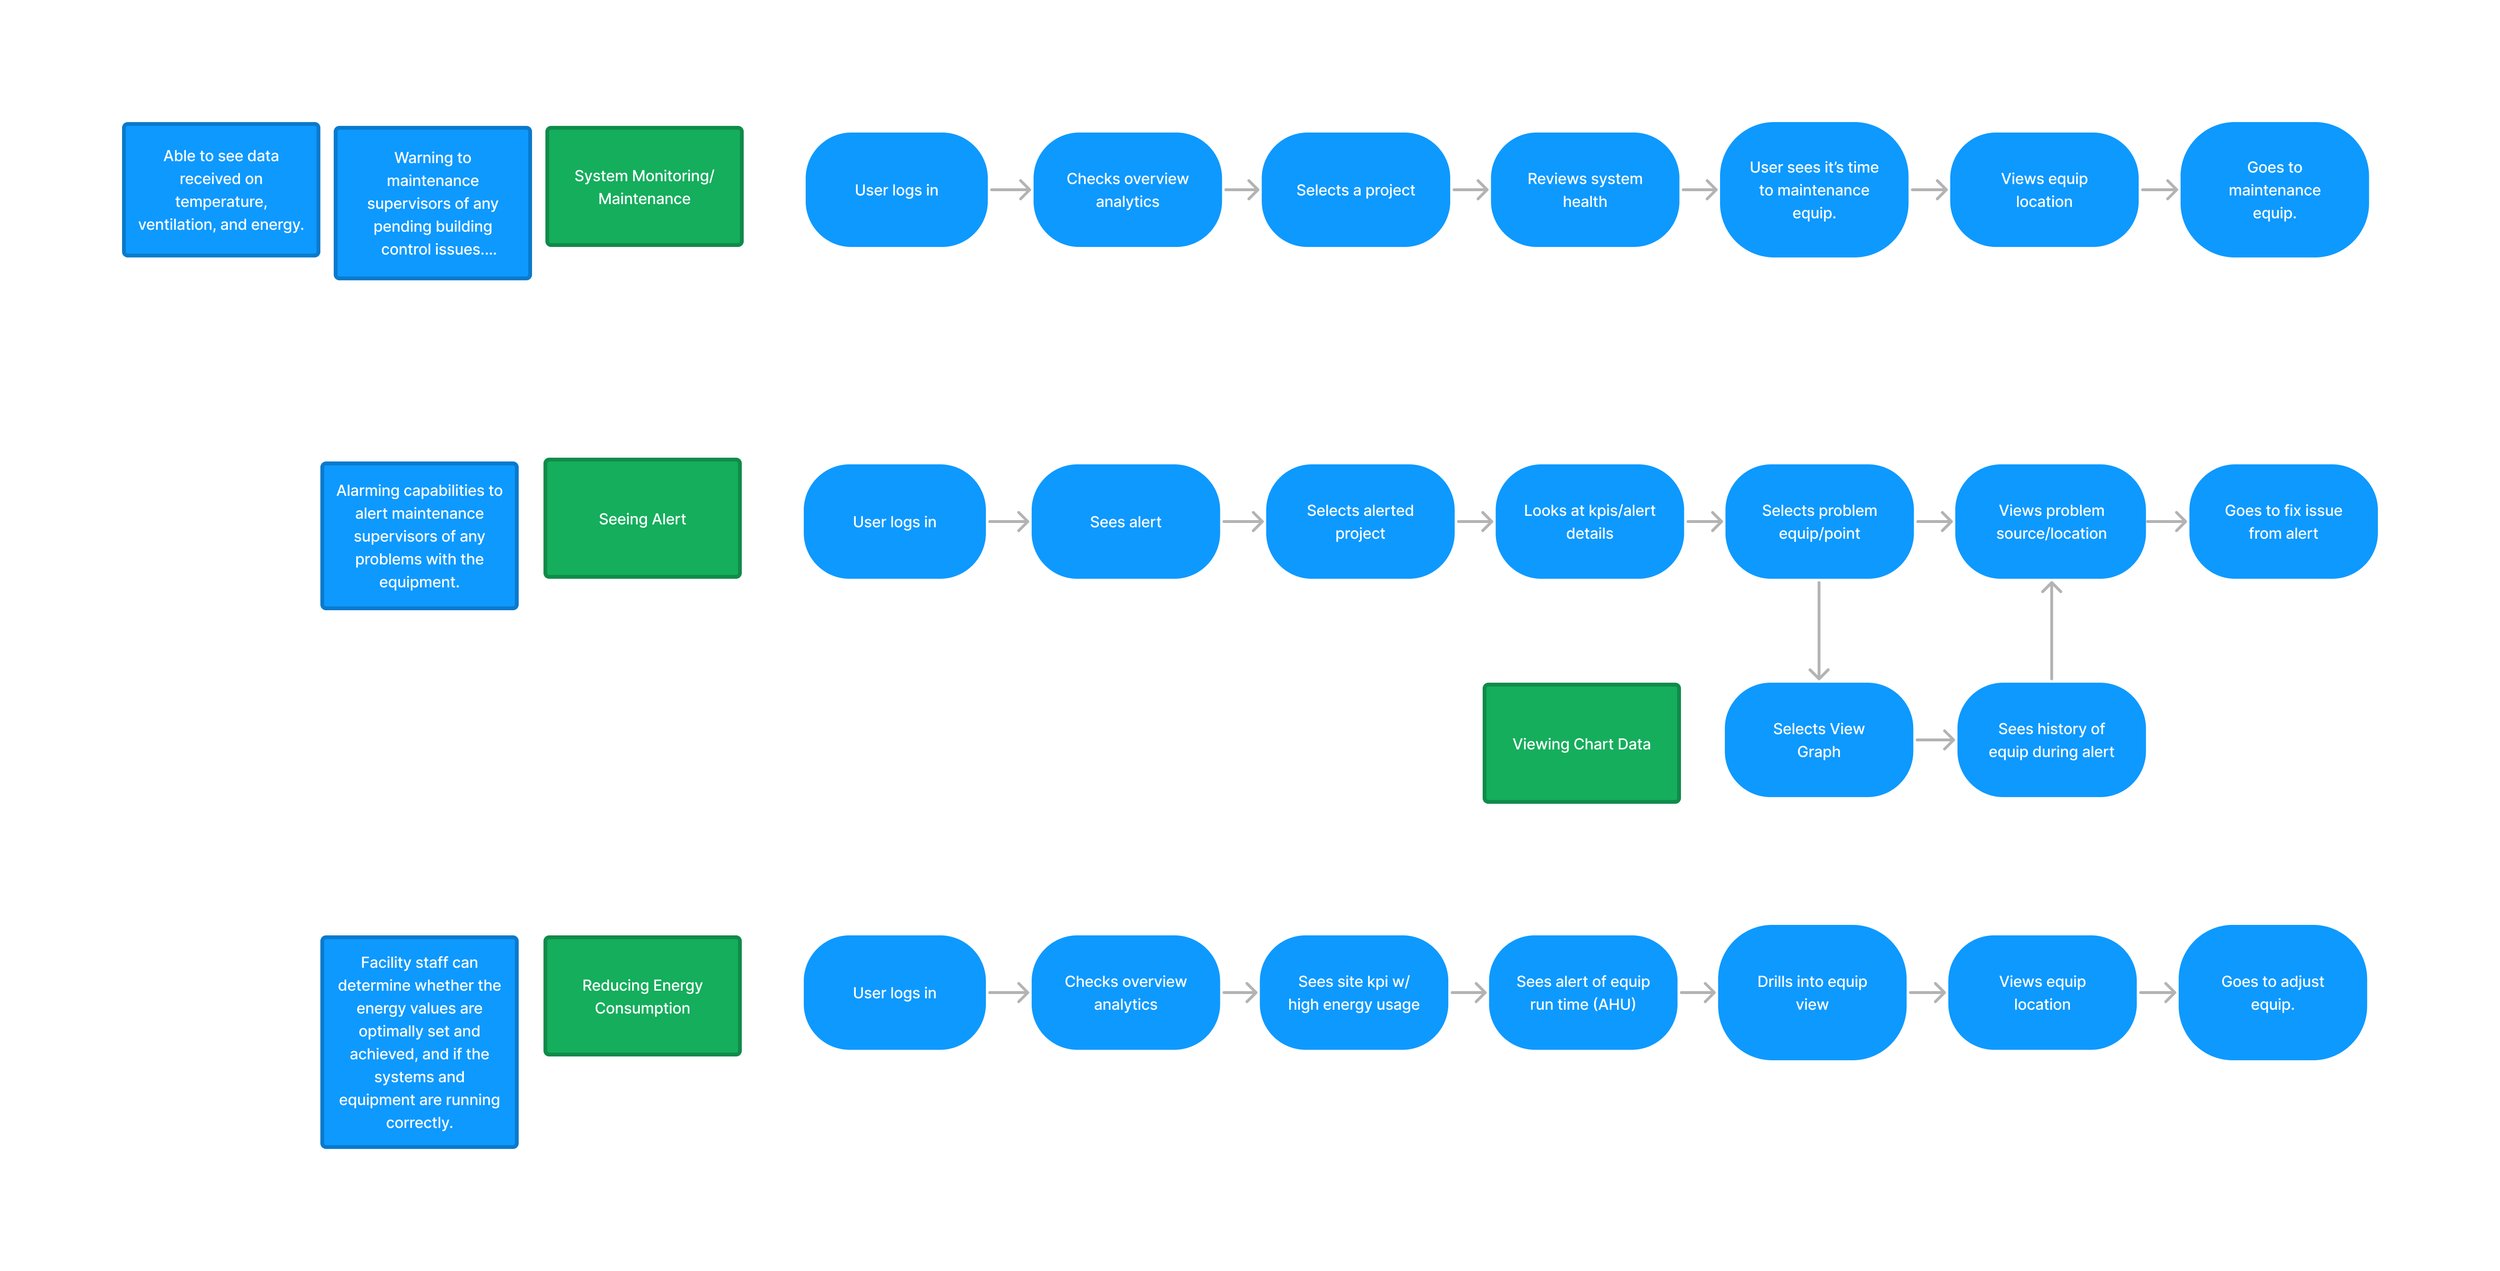
Account Structure
After establishing our users, we then moved to lay out the account structure based on the gathered information.
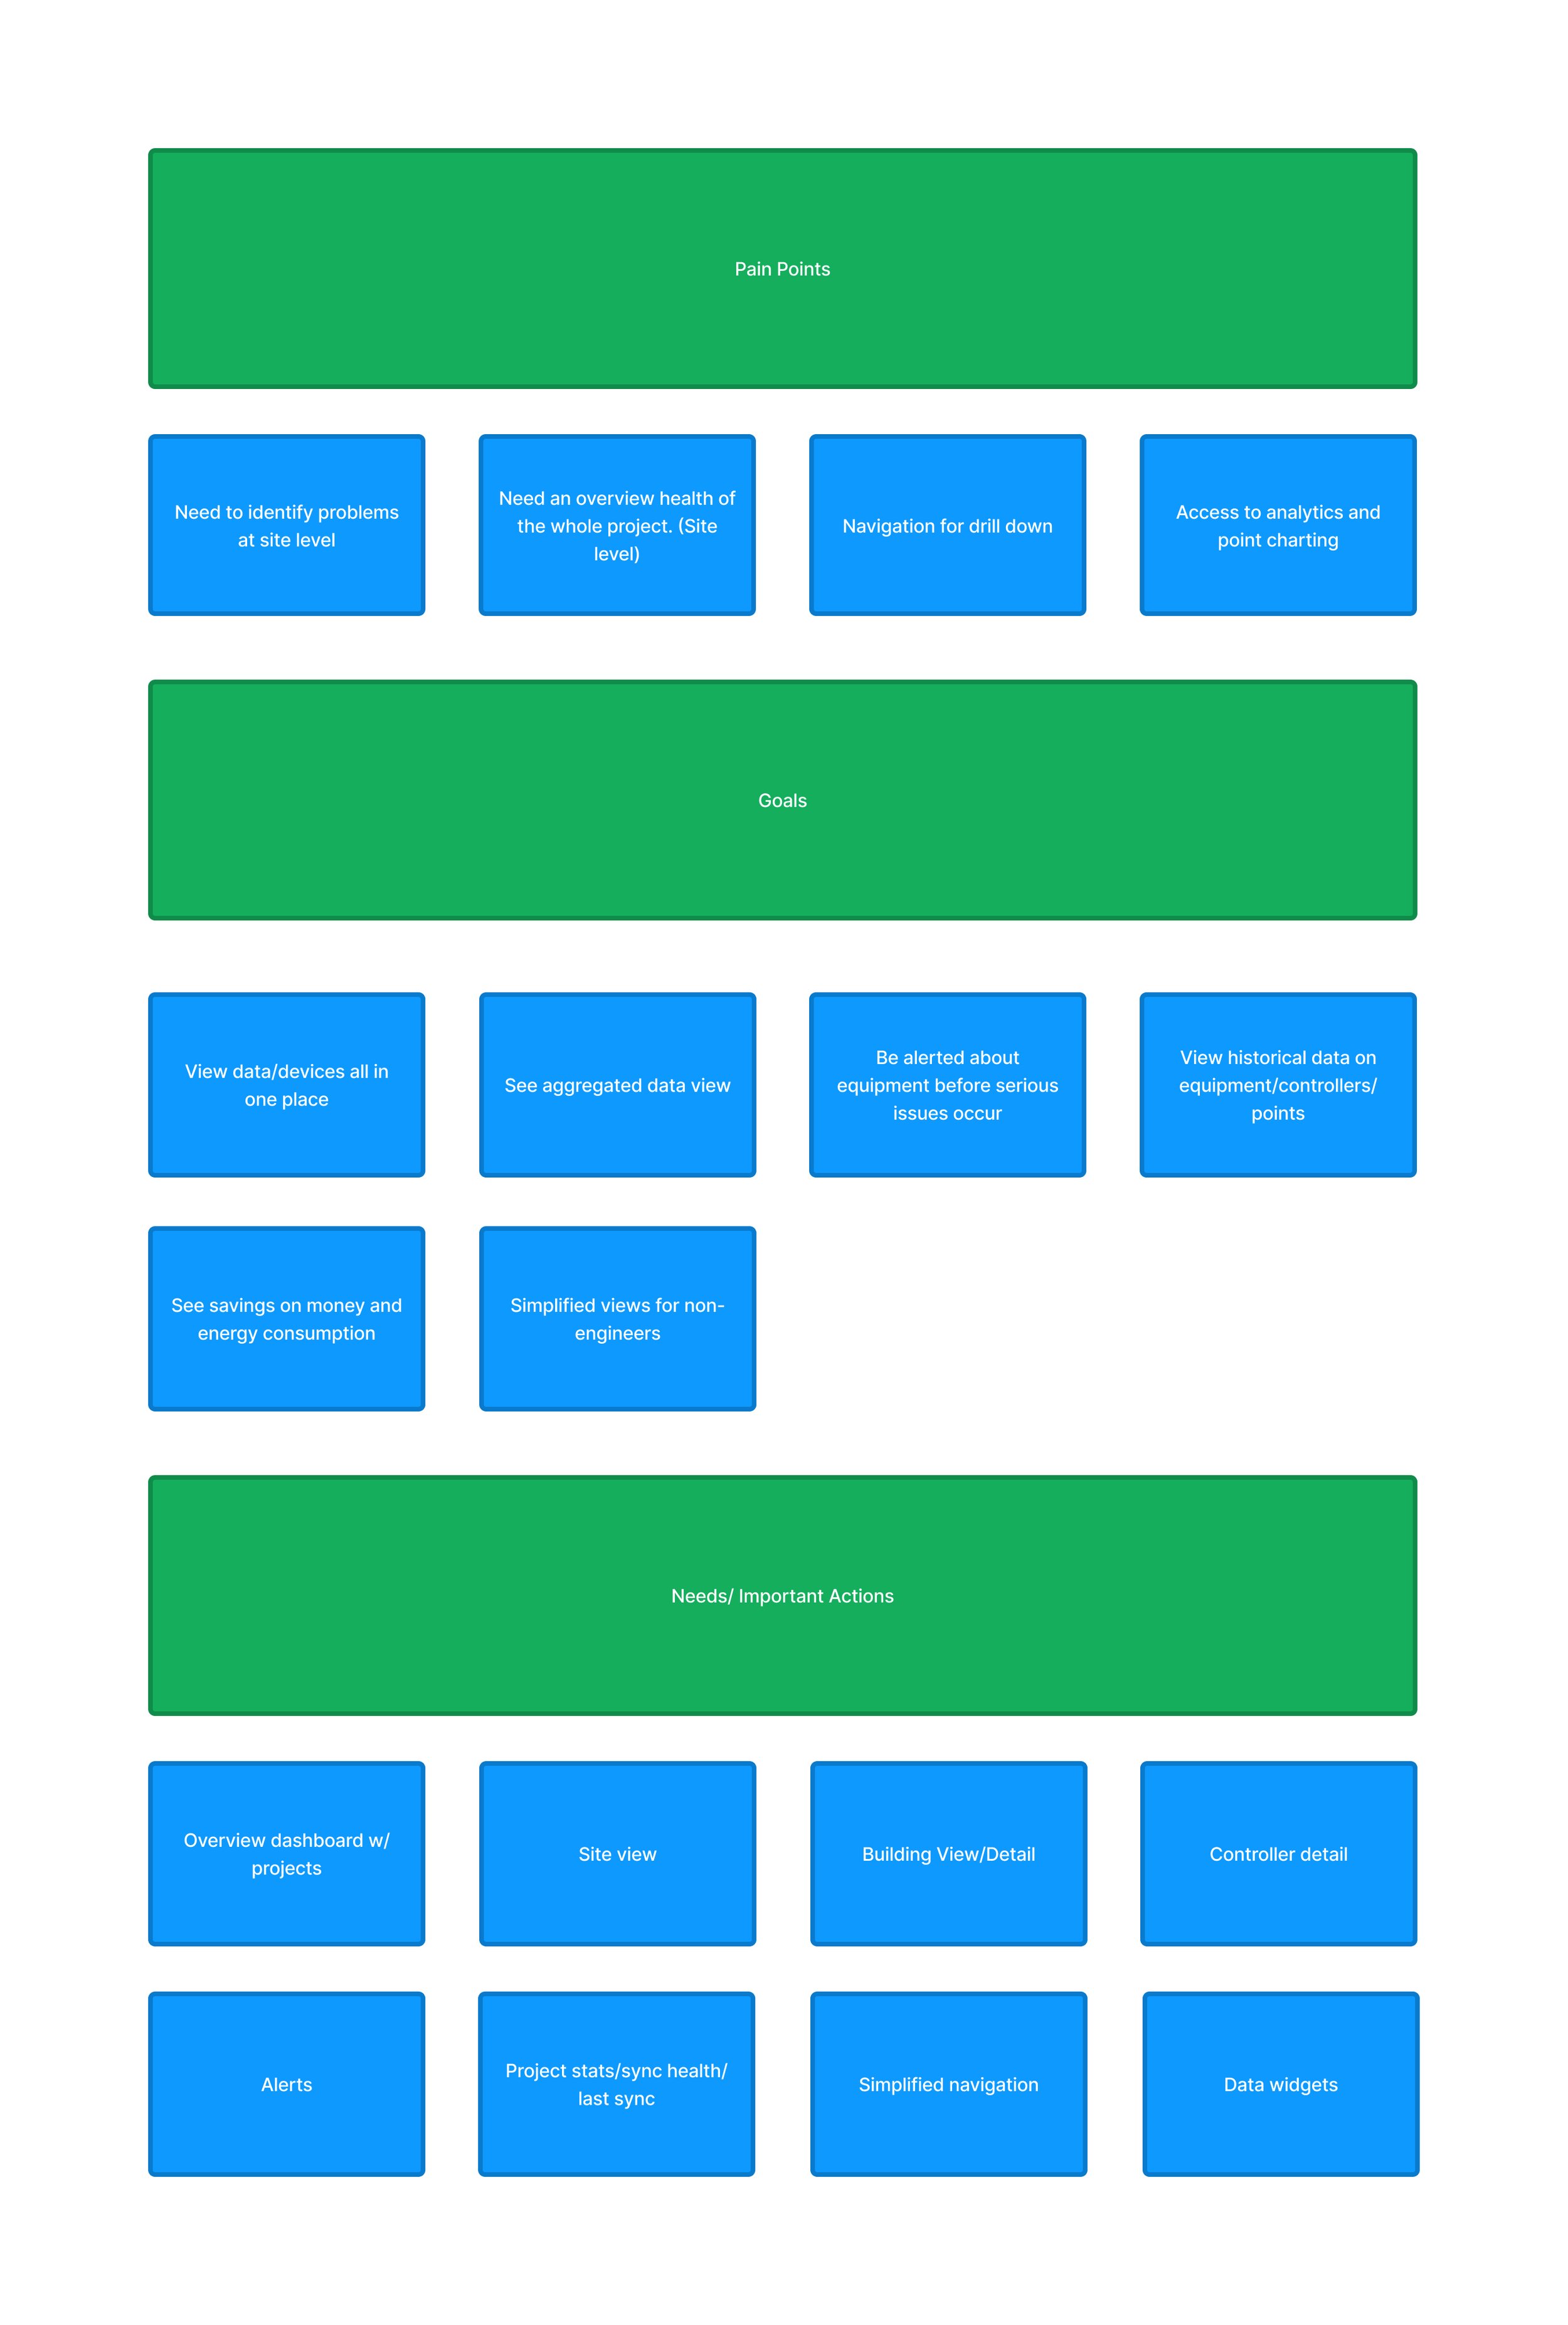
User Pain Points, Needs, Goals + Wireframing
Diving in deeper after the preliminary planning phase, we needed to establish the pain points of our users as well as their needs and goals. This would then help inform the overall structure and changes to the legacy product which led to our wireframing stage.
Major pain points:
Application navigation through levels (Project > Site > Equipment > Point).
Accessing and utilizing analytics within the application.
Needing an overall health status of their system.

Design
Once the research and planning phases were completed, it was time to tackle the design to be handed over to development.
Three main focuses for this application’s design:
Overview Dashboard: Here users can view KPIs and alerts related to their equipment as well as a list of projects. Most users would only belong to one project but we also needed to keep an admin view in mind.
Drill-in dashboards: The requirements included a way to filter through equipment depending on its location. This involved an overview of the project, site, equipment, and point levels.
Point history: This charting capability was carried over from the legacy application with improvements in mind for the future such as incorporating these analytics within the dashboards themselves.
Overview Dashboard
Project Level Overview
Equipment Overview
Equipment History Analytics
Outcomes
Designs and Figma prototypes delivered for implementation within 6-8 weeks leading into phase 2 of development.
Providing visibility into equipment and analytics coming from client’s devices.
Improved front-end with user experience in the forefront. A major challenge was simplifying a developer-focused application for everyday users.
Providing an easily scalable application with room to grow and build out what users need to see on a daily basis.


